istock 15% OFF Exclusive Promo Code for Photos, Vectors and Video (Code: StockEditor15)

Sponsored Images iStock LIMITED DEAL:15% off with StockEditor15 coupon

businessman analyzing financial investment strateg bb7af2dc 99cf 485d a676 b510c2361cbf

Businessman Analyzing Financial Investment Strategy with Graph businessman graph

holographic stock chart dashboard structure floats in upward direction

Dynamic Holographic Stock Chart Dashboard on Computer Screen

holographic stock chart dashboard structure floats in upward direction

Dynamic Holographic Stock Chart Dashboard Ascending

btc  electronic

3D Bitcoin Cube: Futuristic Digital Currency Visualization Bitcoin cryptocurrency

trading  tezos

Smartphone Trading Tezos with Market Graph Visualization trading Tezos

finance  trading

Finance Trading Visualization in Dark Room finance trading

nft  ethereum

NFT Ethereum Bar Chart Featuring the Number 3 NFT Ethereum

amp  file

Dynamic Computer Screen with Graph Displaying Data Trends

cryptocurrency  blockchain

3D Abstract Cryptocurrency Blockchain Design

  earn  laptop  money  online  woman

Empowered Businesswoman Earning Online with Laptop

  charts  computer  data  desk  document

Business Insights: Professional Analyzing Data at Desk with Charts

  europe  label  brand  product  currency

Euro Banknote: Elegant European Currency for Your Projects

  bank  app  service  finance  online

Man Analyzing Financial Data on Large Screen in Banking App Environment

  analysis  analytics  business  chart  charts

Dynamic Business Analysis with Tablet and Pen on Desk

  house  building  home  money  property

Money-Made House: A Creative Concept of Wealth and Real Estate

  business  businesswoman  cc0  chart

Businesswoman Analyzing Financial Data on Tablet

  analysis  business  hand  charts  audit

Business Analysis on Tablet: Charts and Audits in Focus

Graphs and charts on tablet image - Freephoto

Stock Market Trends Visualized on Tablet Screen

word white paper with print equity

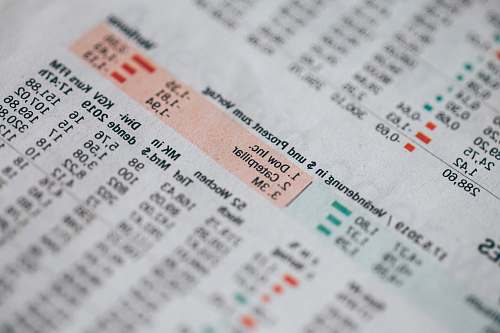
Financial Data Analysis: White Paper and Newspaper with Equity Metrics

Premium images by iStock

Check Also:

Data analytics dashboard display. Business and financial investment. HUD infographic of financial. Information reports of business strategy for investment. 3d rendering 2154830395

data analytics dashboard display.

Forex diagrams and stock market rising lines with numbers 1407983911

forex diagrams and stock

Financial Business Charts, Graphs And Diagrams. 3D Illustration Render 1144573725

financial business charts

Analyzing Digital Data - Copy Space - Statistics, Financial Chart, Economy 1435226184

analyzing digital data

Business graphs, charts and magnifying glass on table. Financial development, Banking Account, Statistics 1341785038

business graphs charts

Two data analysts Working on data analysis dashboard for business strategy. 2148804792

two data analysts working

Diagrams projecting from tablet 494497554

diagrams projecting from tablet

Robot processes the signal for opening or closing the order to buy and sell stock and cryptocurrencies 2148360448

robot processes the signal

Analyst working with Business Analytics and Data Management System on computer to make report with KPI and metrics connected to database. Corporate strategy for finance, operations, sales, marketing 1286642964

analyst working with business

Financial and Technical Data Analysis Graph 1145882183

financial and technical data

financial graphs background 955408648

financial graphs background

Business Team Analyzing Interactive Digital Dashboards with Data Visualizations 2193247029

business team analyzing interactive