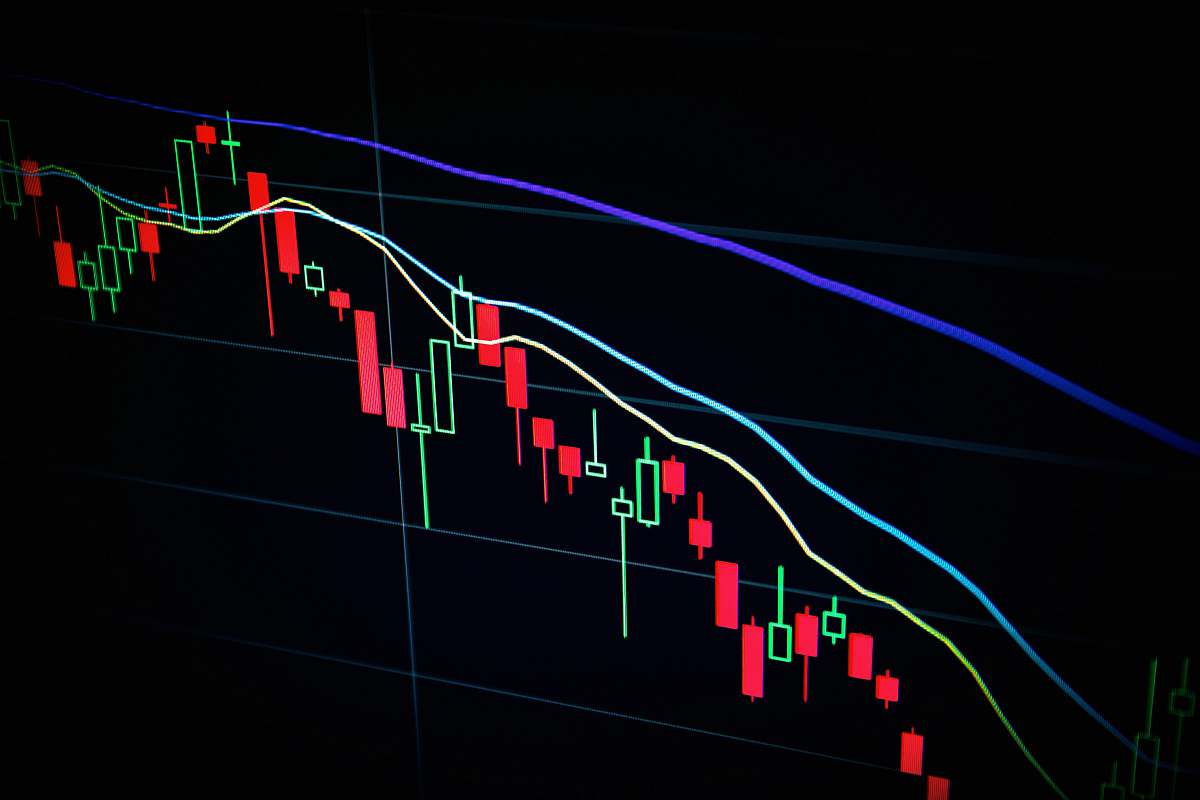
Abstract Financial Graph with Up Trend Line
High Resolution JPEG Picture of Abstract financial graph with up trend line candlestick chart in stock market on neon light colour background
This image features an abstract financial graph representing an upward trend in the stock market, depicted through a candlestick chart against a vibrant neon background. The graph's design efficiently illustrates financial data, making it suitable for various analytical contexts. The distinct colors and graphical elements highlight key market movements, enhancing the visual appeal for audiences engaged in finance and investment.
This image can be effectively utilized in commercial and educational environments. It is suitable for financial reports, investment presentations, and analytical articles. Marketers may incorporate it into social media posts, infographics, and website banners to convey financial insights. Additionally, it may serve as a visual element in eBooks and mobile applications, making it a versatile asset for professionals in finance and education.