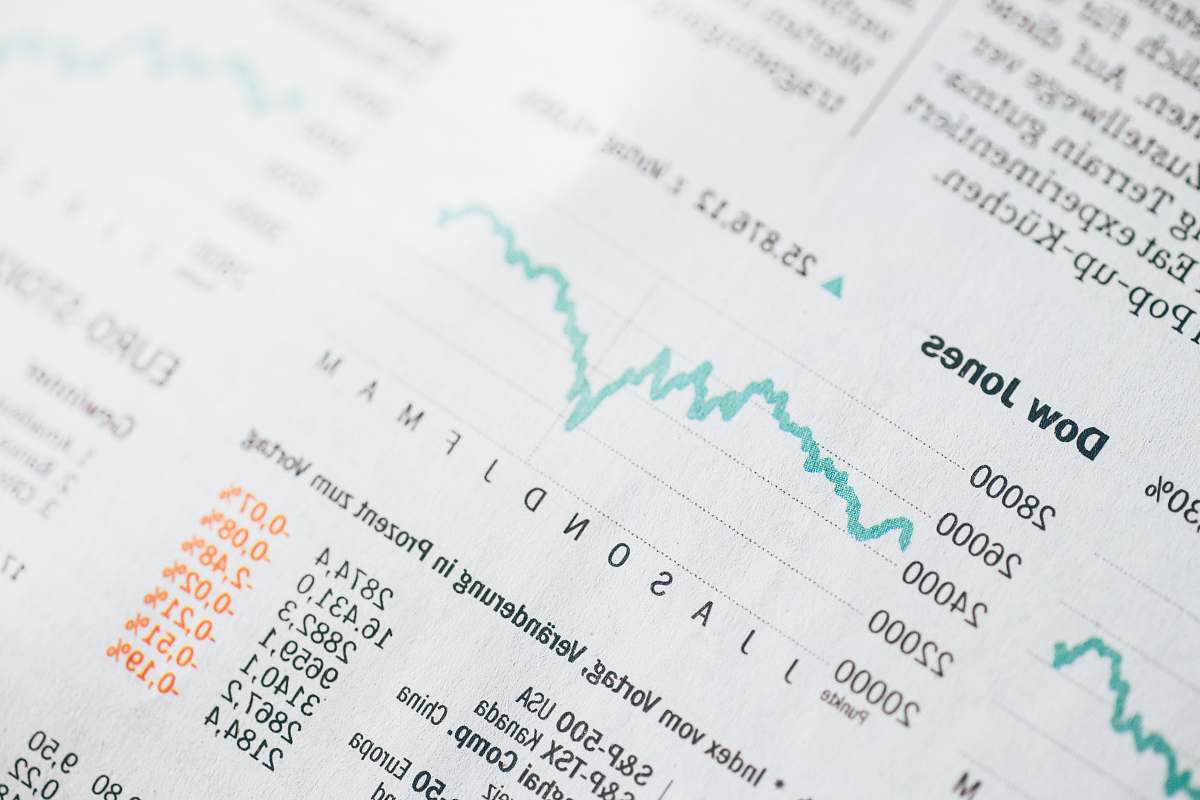
Abstract Financial Graph with Up Trend Line Chart
High Resolution JPEG Picture of Abstract financial graph with up trend line chart in stock market on grey colour background
This image illustrates an abstract financial graph showcasing an upward trend line chart, set against a subdued grey background. The graph represents stock market trends, providing a visual representation of financial growth and data analysis. Its clean design and modern aesthetic make it suitable for a variety of applications in finance, business, and analytical contexts. The use of contrasting lines enhances clarity, allowing for easy interpretation of the data depicted.
This abstract financial graph can be utilized in numerous real-world applications such as financial presentations, market analysis reports, and educational materials. It is suitable for use in infographics, websites, mobile applications, and social media content where finance-related themes are discussed. Additionally, it can serve as a background for eBooks, online courses, and printed materials focusing on investment strategies, economic forecasts, and stock market insights.


