Currency and Exchange Stock Chart
High Resolution JPEG Picture of
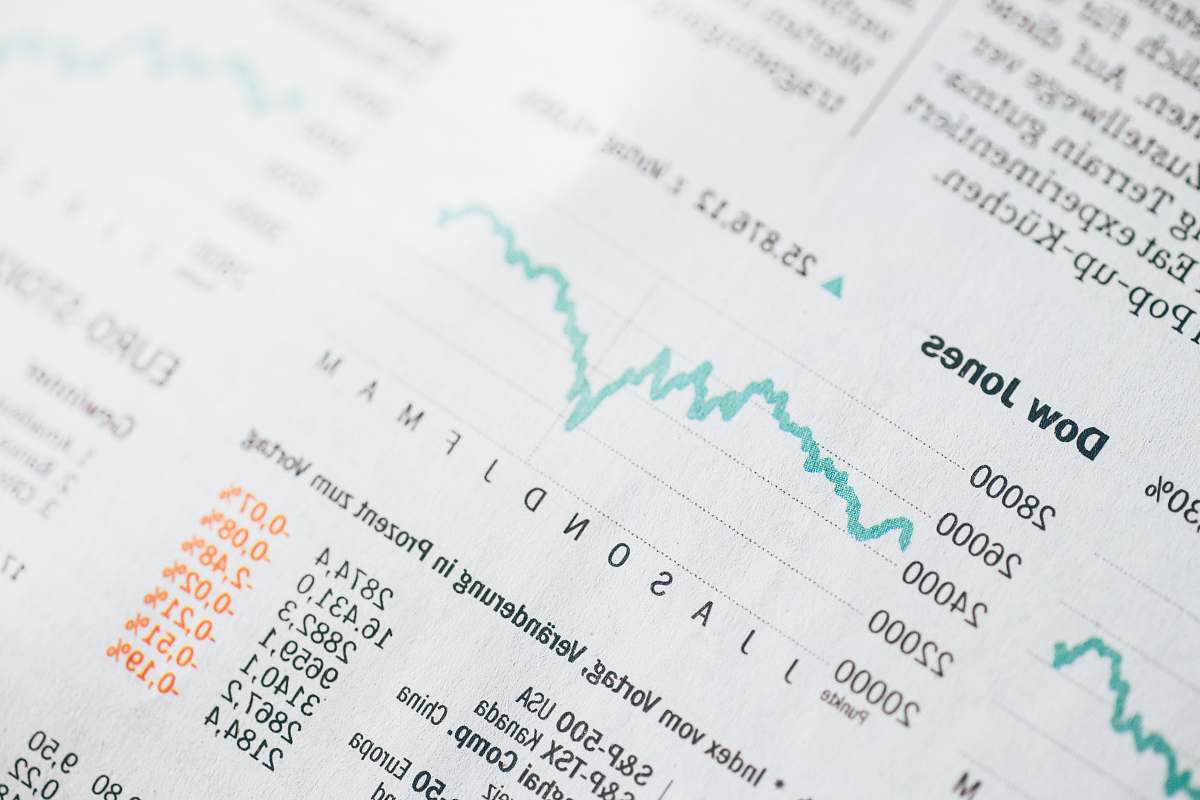
This image captures a detailed stock chart that illustrates various currency exchange rates over time. The chart displays fluctuations and trends, making it a valuable resource for anyone interested in finance or economics. The design is clean and easy to interpret, showcasing a range of currencies and their respective values. This makes it suitable for analysis, presentations, and educational contexts.
This currency and exchange stock chart can be effectively utilized in multiple commercial and educational formats. It is ideal for finance-related websites, infographics, and eBooks. Additionally, it can enhance presentations, social media posts, and mobile UIs related to economic topics. Whether for an educational worksheet or a financial report, this image serves as a practical visual aid for conveying important data.