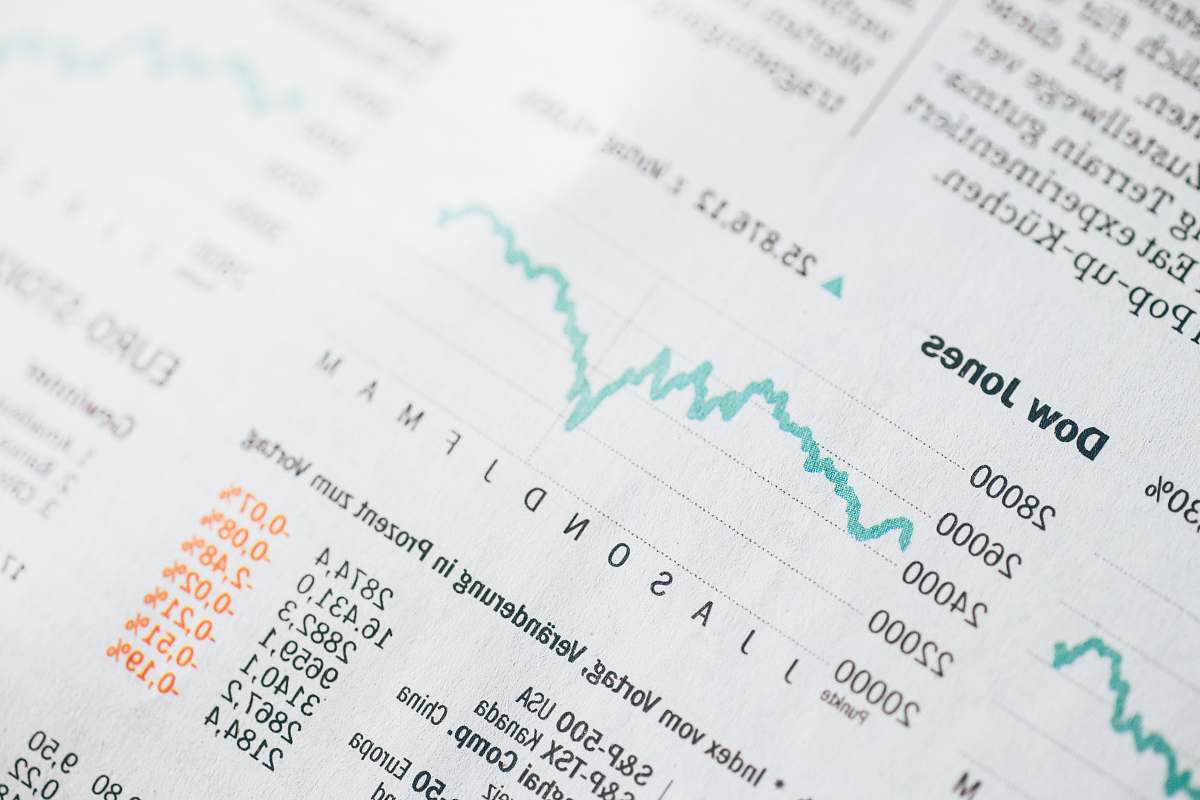
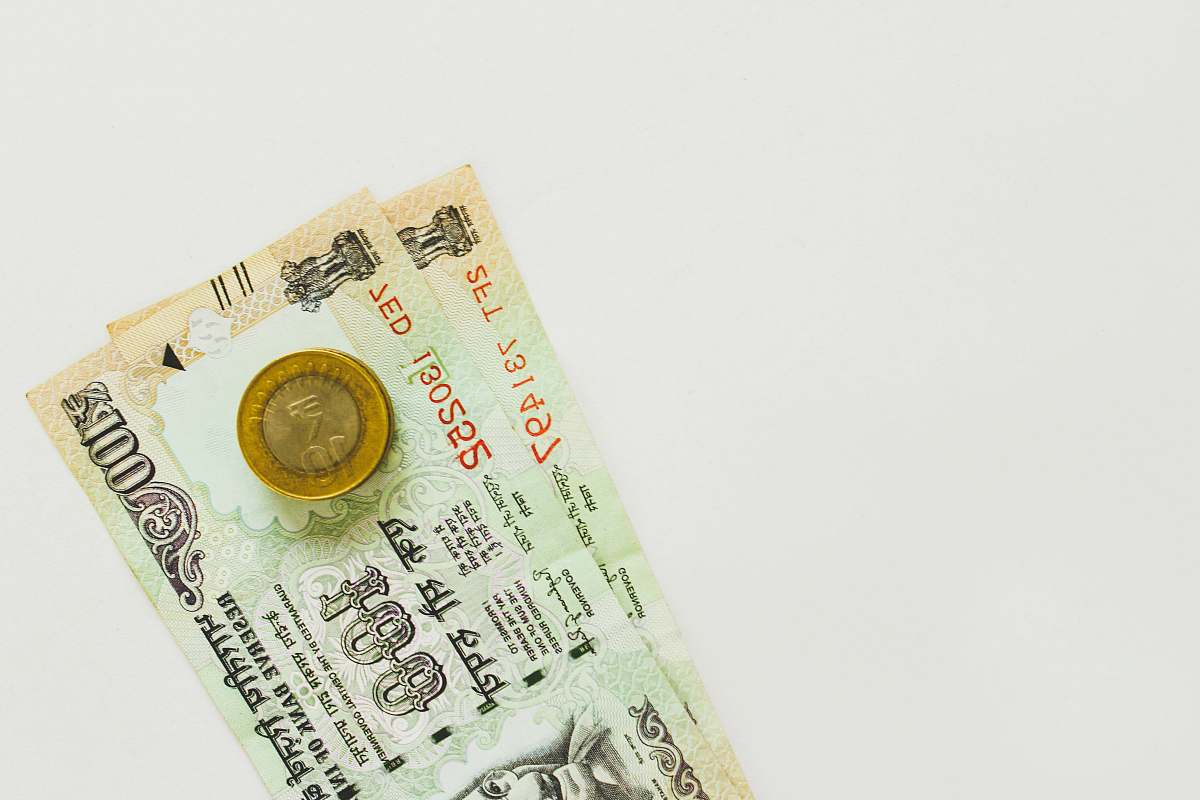
100 Dollar Banknotes with Stock Market Chart
High Resolution JPEG Picture of Dollars 100 banknotes with stock market chart graph for currency exchange and global trade forex concept
This image depicts a collection of 100 dollar banknotes arranged next to a stock market chart graph. The currency notes represent financial transactions, while the chart illustrates the trends in currency exchange rates. The clear presentation of both elements highlights the relationship between money and the stock market, making it suitable for financial analysis and educational materials.
This image can be effectively utilized in various commercial and educational contexts. It may serve as a visual aid in finance-related presentations, articles, and social media posts. Additionally, it can be incorporated into infographics, eBooks, and financial reports, helping to convey complex information succinctly. Website designers can also leverage this image for banking or investment-related themes, enhancing user engagement.