Financial Static Analysis Growth Chart for Online Trading
High Resolution JPEG Picture of
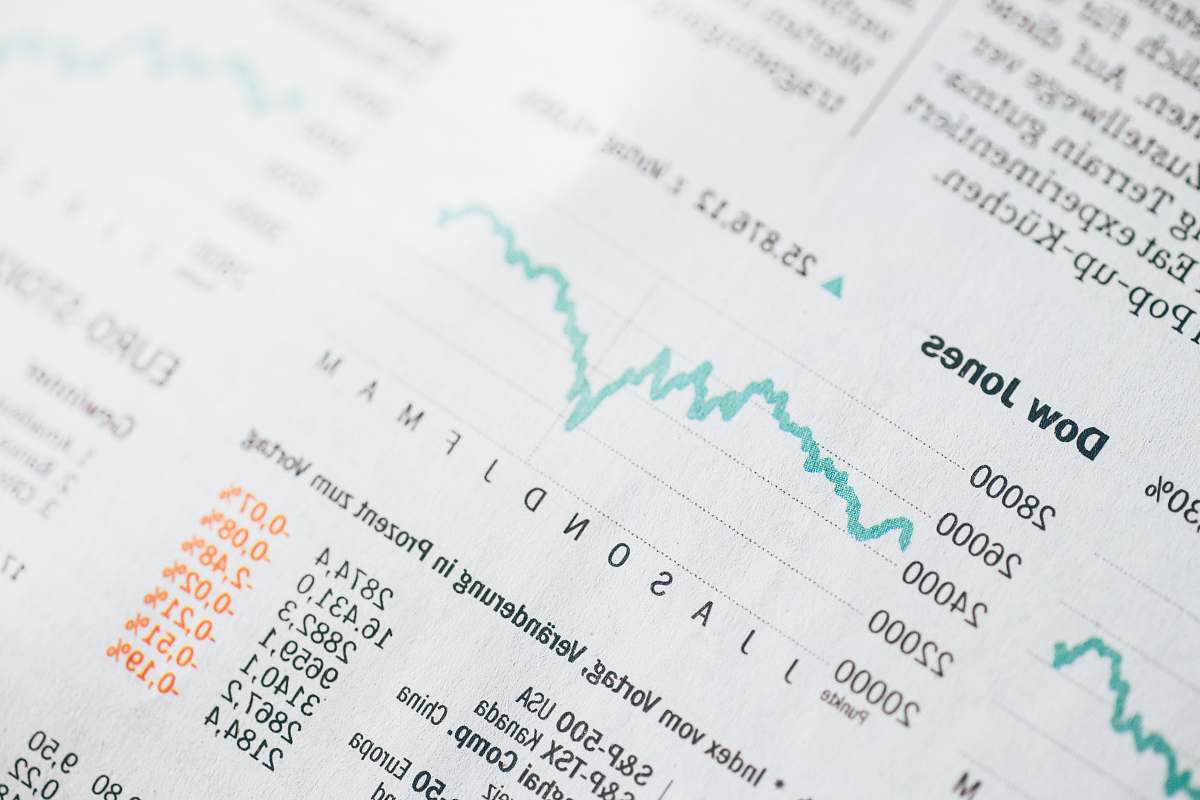
This image showcases a financial static analysis growth chart specifically designed for online trading and investment. The chart features clear data visualizations that illustrate investment trends, trading volumes, and market performance over time. The design is structured to be both informative and easy to interpret, making it suitable for various applications in finance and investment analysis.
This growth chart can be utilized in numerous commercial and educational contexts. It is perfect for financial reports, trading platforms, and investment strategies. Use it in infographics, presentations, and eBooks to communicate complex data effectively. Additionally, it can enhance social media posts and marketing materials aimed at promoting financial literacy or online trading services.