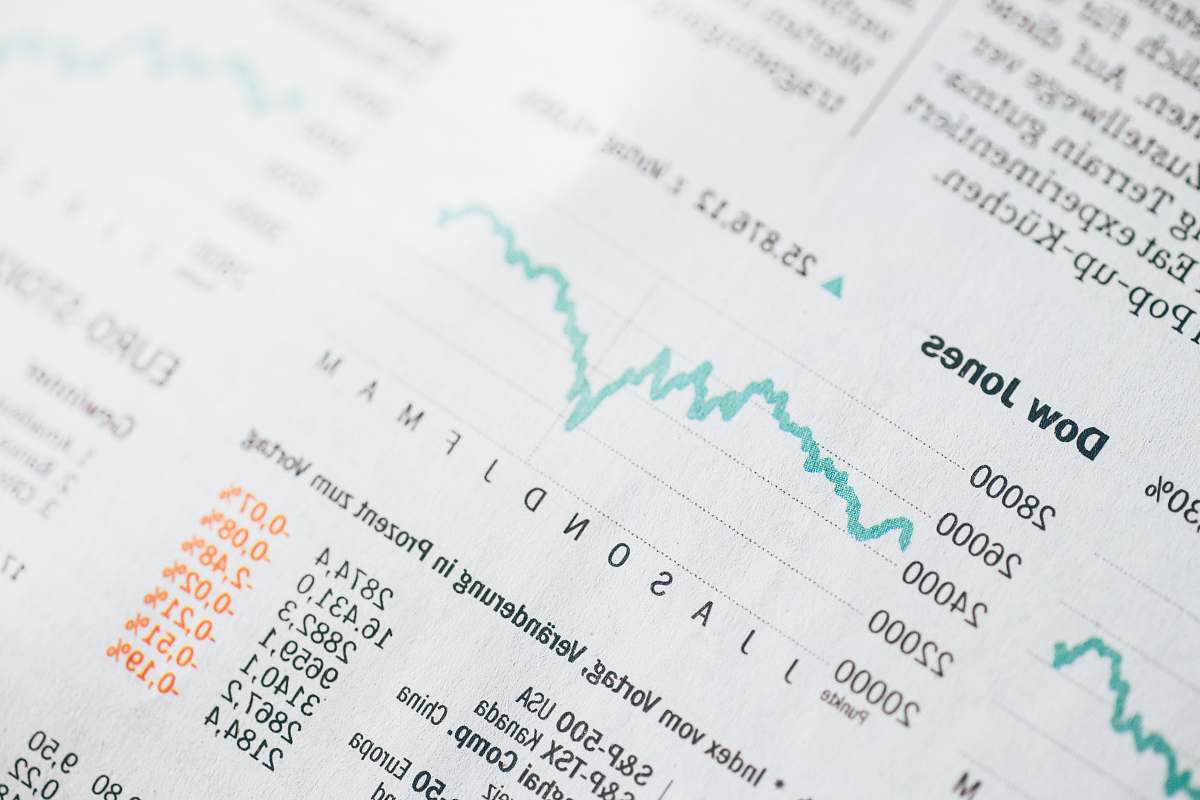
Graph of Stock Market Dynamics
High Resolution JPEG Picture of
This image displays a graph representing stock market dynamics, featuring both line and bar charts. The visual captures fluctuations in market trends, making it an informative tool for analyzing economic movements. The design is clear and straightforward, emphasizing essential data points relevant to market performance. This representation serves professionals in finance and education, facilitating an understanding of stock price changes over time.
This image can be effectively utilized in various commercial and educational contexts. For instance, it can enhance financial reports, be integrated into infographics, or serve as a visual aid in presentations related to market analysis. Additionally, it is suitable for use in online articles, social media posts, eBooks, and websites focused on finance, investment strategies, or economic trends, making it a versatile asset for diverse content creators.