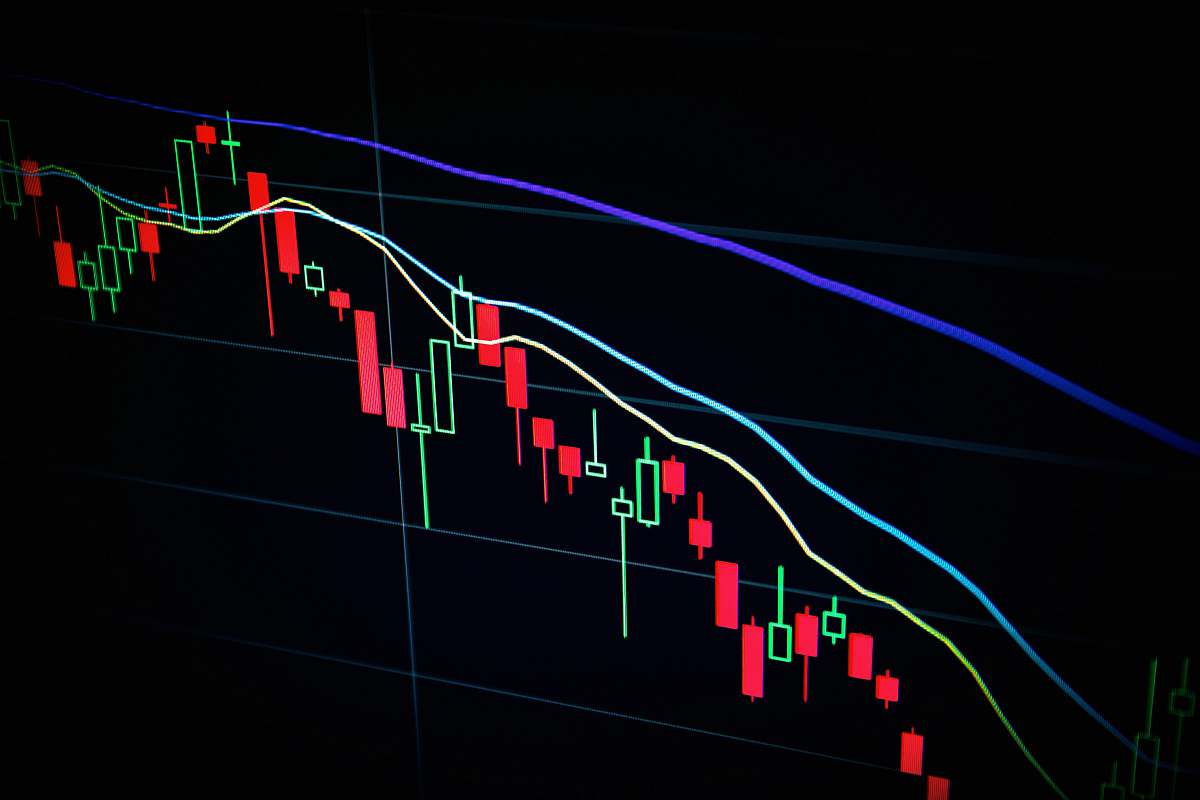
Red Candlesticks Illustrating Crypto Trading Volatility
High Resolution JPEG Picture of The red crashing market volatility of crypto trading with technical graph and indicator, red candlesticks going down without resistance, market fear and downtrend. Cryptocurrency background concept. TradingView
This image features a technical graph depicting the volatility in cryptocurrency trading, characterized by red candlesticks indicating a downward trend. The graphic captures the essence of market fear and the lack of resistance in the crypto space. Visual elements such as indicators and market analysis tools are present, making it a valuable resource for those interested in cryptocurrency trends and trading strategies.
This image is suitable for a variety of commercial and educational applications. It can be used in financial reports, trading blogs, or cryptocurrency analysis presentations. Ideal for websites focused on market analysis, social media posts about trading tips, infographics about crypto trends, and eBooks related to finance and investments. The graphic can also serve as a background for mobile UI designs emphasizing trading applications.


