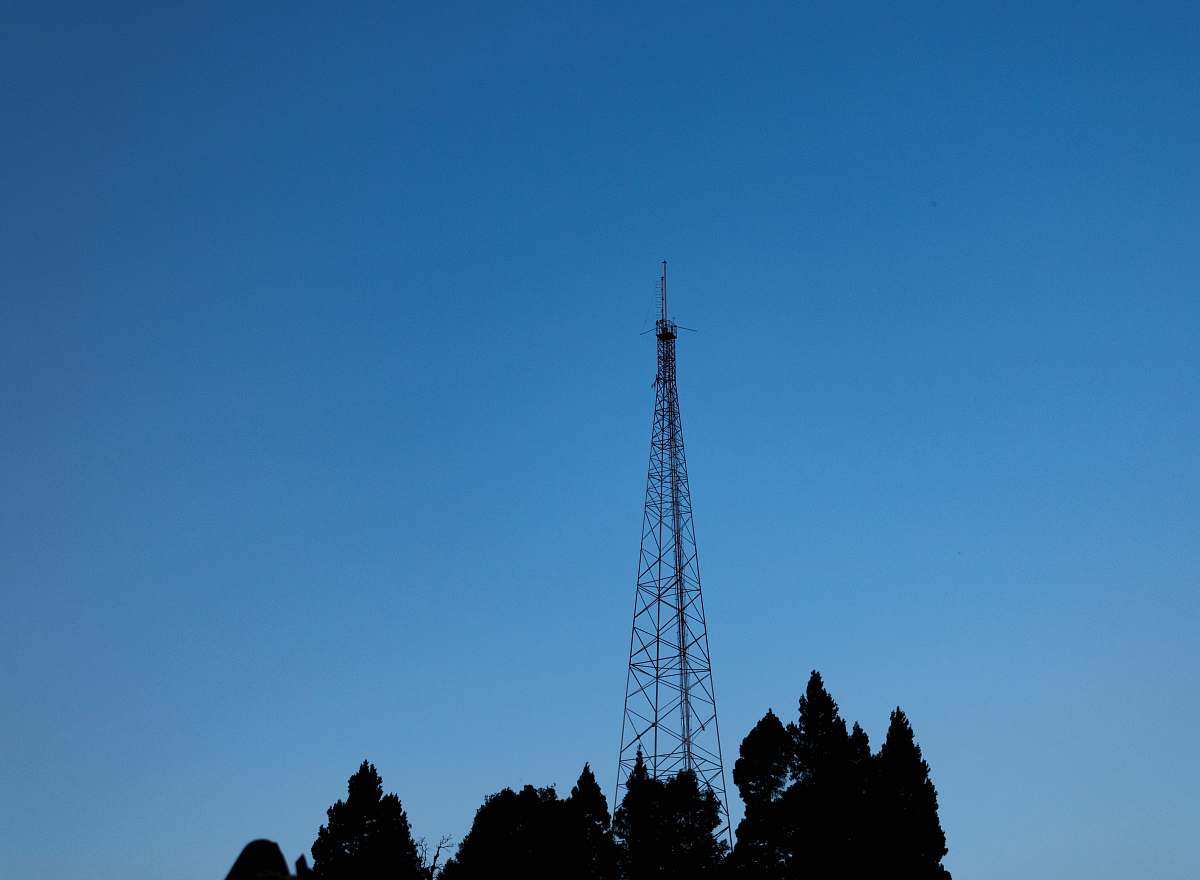
Transmission Tower with Electricity Prices Sparkline Chart
High Resolution JPEG Picture of Transmission tower and raising sparkline chart representing electricity prices rise during global energy crisis.
This image features a transmission tower prominently displayed next to a sparkline chart that illustrates the upward trend of electricity prices. The transmission tower symbolizes the infrastructure of energy distribution, while the sparkline provides a quick visual representation of price changes over time. This composition effectively blends technical elements with data visualization, making it suitable for discussions around energy trends and economics.
This image can be effectively utilized in various commercial and educational contexts. It serves well in industry reports, financial presentations, educational material on energy economics, and infographics. Additionally, it can enhance websites focused on energy, serve as a visual aid in social media posts discussing electricity market trends, or be incorporated into eBooks and mobile apps related to finance and energy management.